The Word Search function is a tool to help managers find trends or correlations between information recorded in notes across the database.
The tool allows managers to interrogate qualitative data to track themes within client communication with your staff.
Please review the instructions below, or view the following video:
Instructions
Step 1. Log into your CRM database (refer to Logging On for further information).
Step 2. Add the Word Search Dashlet to your Dashboard
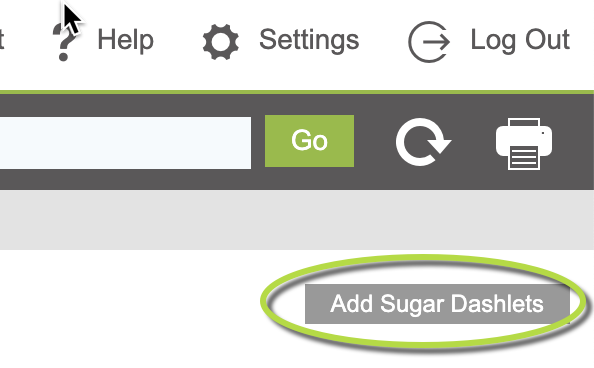
Click on Add Sugar Dashlets
Tip:
Look to the top right of your screen

Only users with the manager role have access to this tool.
If you don't have the manager role, but believe you should, talk to your database manager.
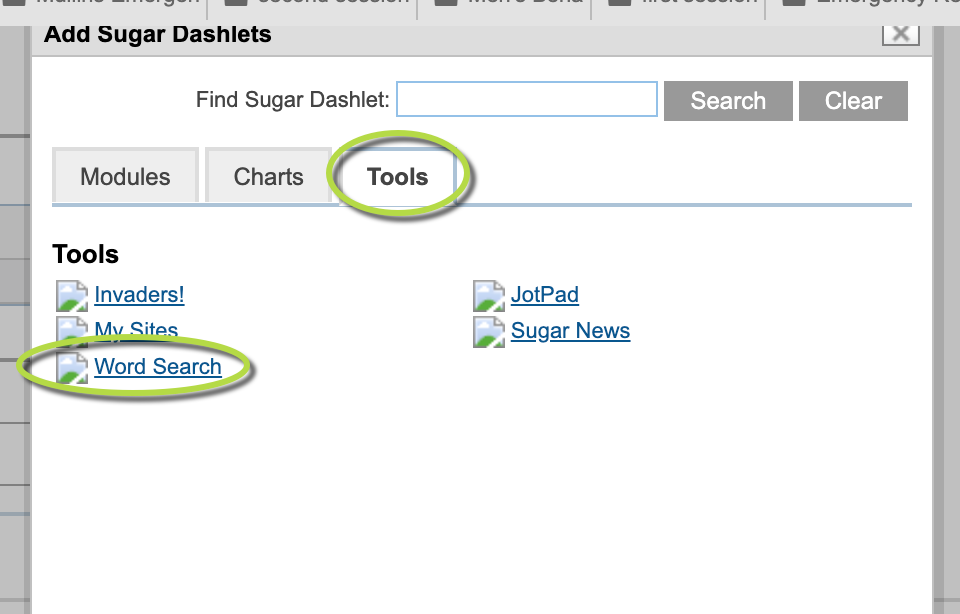
Step 3. The “Add Sugar Dashlets” popup box will appear
Click on the Tools Tab
Then
Click on Word Search -> This will add the Word Search Tool to your Dashboard
Tip:
You need to click on the Tool "Word Search" to add it, drag and drop won't work.
Step 4. Close the “Add Sugar Dashlets” popup box
If you have the manager role, the Word Search search box will be displayed on your dashboard
Tip:
Not able to see the X (close) button at the top of the popup box,
don't panic, click on the Dashboard button top left of your screen next to the Activities Menu.
This will close the popup box
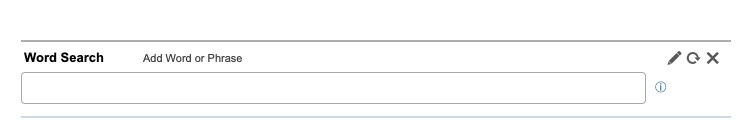
Step 5. Enter the first search terms/ key word
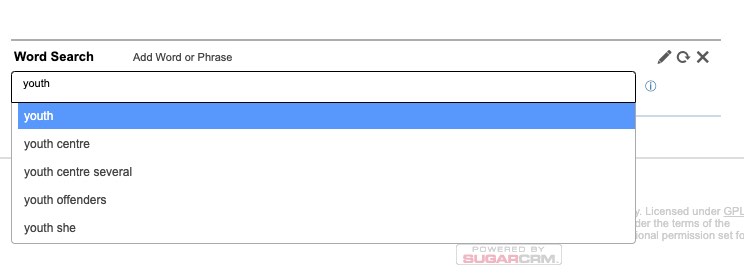
As you type, available options will be displayed.
Step 6. Select the required option from the list
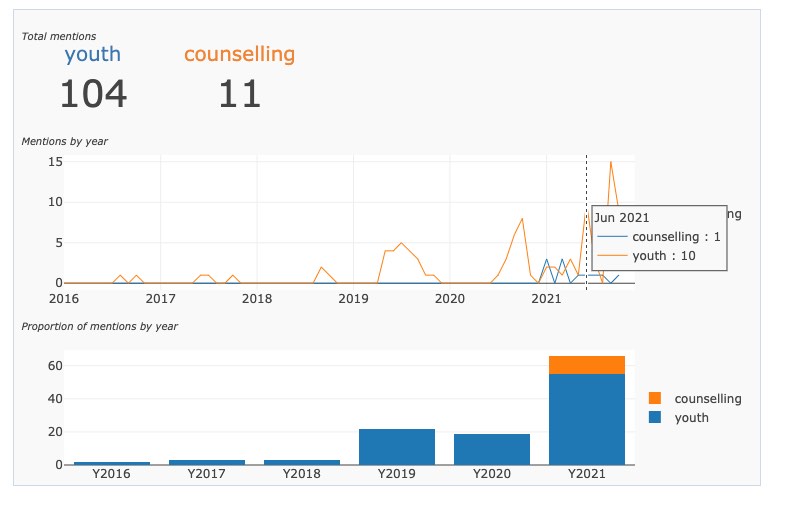
Details for the selected option will appear
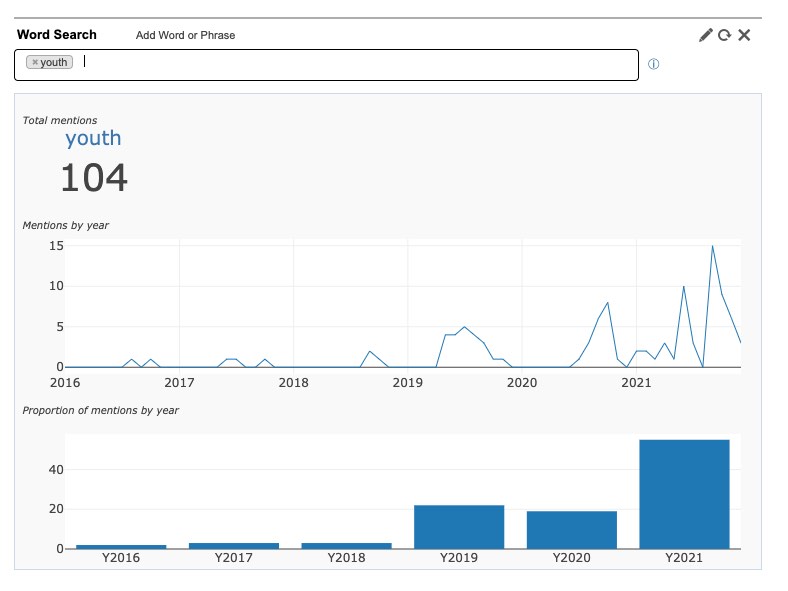
The top graph shows a count of mentions of the word per month and year as a line graph
The second graph shows a count of mentions per year as a stacked column graph.
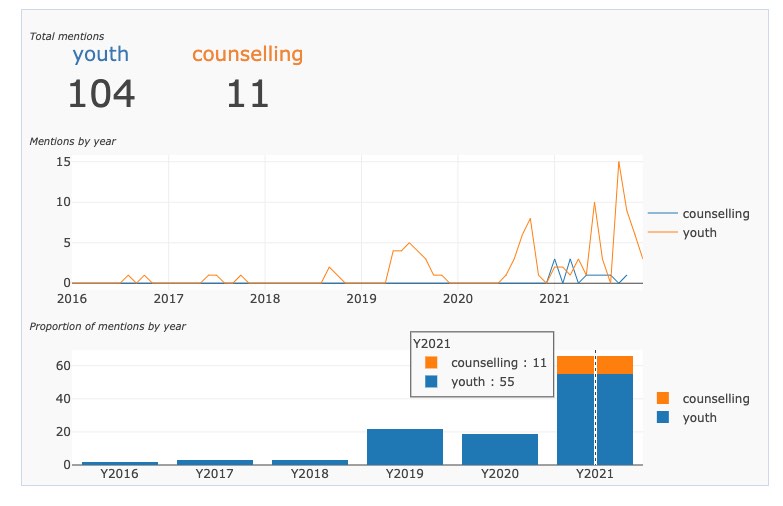
Step 7. Enter an additional key word in the search field.
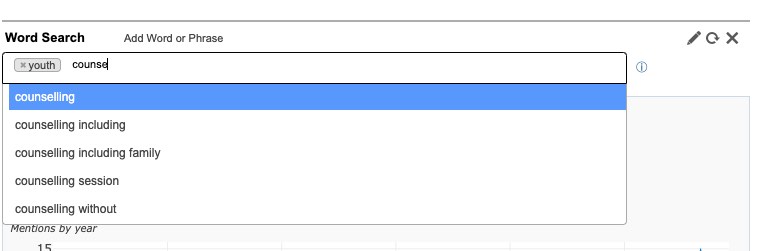
Step 8. Select the required option from the list
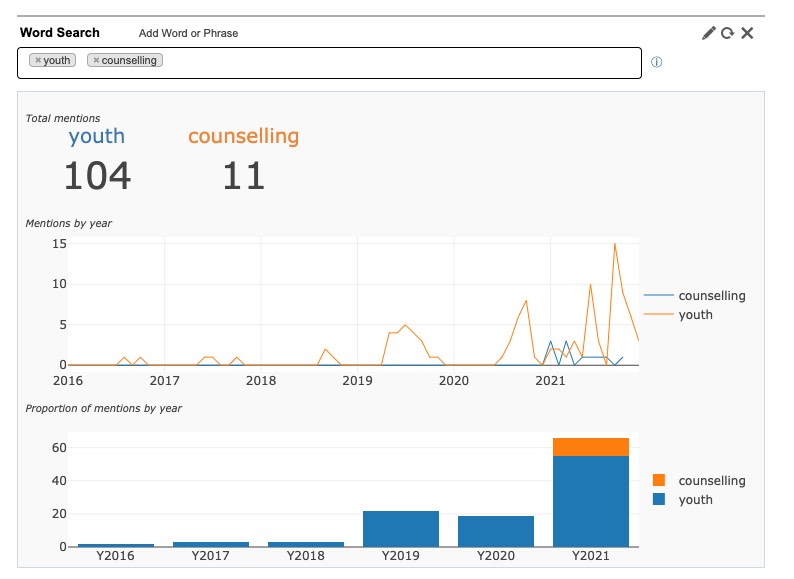
The top graph shows a count of mentions of each word per month and year as a line graph
The second graph shows a count of mentions per year as a stacked column graph.
Step 9. Hover your mouse over the graphs to display further information.